


Extensive technological progress and enhanced analysis methods have led us into the modern era of data. This is where web analytics takes the lead. But the question is, can companies with all these new capabilities – and most importantly data – at their fingertips use them to the fullest? In other words, how can organizations apply data-driven strategies for decision-making processes to achieve a competitive edge?
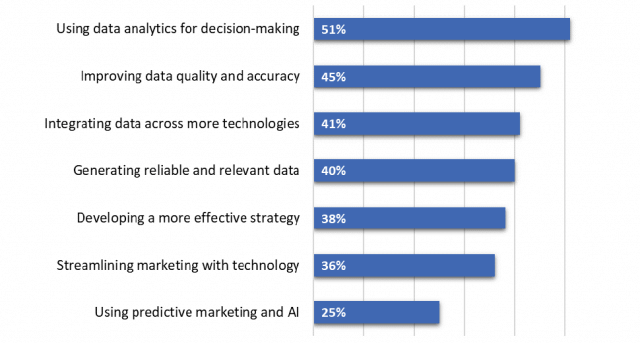
As stated in a report by Forrester, 74% of organizations aim to be data-driven, but only 29% declare that they’re skilled at putting analytics into practice.
How web analytics data and decision-making go hand in hand
Organizations need to get a complete picture of their performance. The proliferation of data is rooted in this business need. Data is the foundation for any organization that wants to make informed decisions.
That’s why companies turn to web analytics. The data they gather helps businesses refine the way they operate, organize and plan.
Data-based decision making means that organizations apply data analytics on a daily basis. And it should feature at every level of an organization, not just top executives.
Of course, roles can be divided. Still, at the end of the day, everyone involved in your company’s performance should be fully aware of the purpose and impact of data analysis on the organization.
Web analytics is one avenue to improve your company’s performance. And you don’t need to be a data specialist to reap the rewards. The key is to devise the right strategy. We’ll show you how to do it in a couple of steps.
How to devise a strategy for data-based decisions
Everyone is talking about data-driven decisions, but what, exactly, does this term mean? It means that you gather data, extract patterns from it, analyze it and finally use your findings to decide what steps you still have to take.
So simple, but so complex. Never fear, we’ve prepared some actionable steps for you to follow when developing an informed strategy.
Step 1. Have a clear purpose for collecting data
When it comes to data and analysis, clarity should be your leading principle. As you gather data, you need to know exactly what purpose you’re doing it for, what can you achieve with it.
Different organizations have different definitions of better performance. This also applies to the kinds of data you want to gather, aggregate and finally analyze.
Your company’s goals should dictate what data you need. The process of collecting data should be aligned with your business objectives to build a sound strategy.
In order to better define the reasons why you’re gathering data, you should think if you want to:
- reduce costs
- drive revenue
- boost productivity in your team
- foster innovation in product development
- shorten the development process of your products
- improve effectiveness of your service or product
Step 2. Dive into your sources and choose the right data
Gone are the days when you struggled to find and acquire data. Today, with the abundance of data sources you face the challenge of cutting through the noise and identifying the right ones.
Often organizations have the data they need, but they don’t know how to apply it in their decision making.
First, it’s important to promote a broader perspective on data. This means you need to select data based on the problems you want to solve and scenarios you’re considering.
Second, look for all possible sources of data. If you want to make good use of data, bear in mind that you’ll be dealing with a real mixed bag. You can get a ton of data, but it might be inaccurate or misleading.
That’s why you need to stay on the lookout and always:
- check and verify your data sources
- establish how data was collected
- search for different sources on data, don’t rely on a single one.
In addition, note that data points come in all shapes and sizes. You can have
- maintenance reports
- PowerPoint presentations
- social media posts
- and so on.
Consider also local demographics, monitoring, apps, surveys, weather forecasts and so on.
The list is long, so how you approach it is a matter of your invention and creativity. Sometimes, when you got stuck in a rut, you might overlook untapped sources of information.
Data points naturally vary in their quality – some are stronger than others. That’s why you need to find the ones that fit into a particular context. Moreover, it’s vital to have a data model that lets you recognize and evaluate input sources for reliability.
Step 3. Break down the processes
When you’re focused on the prime objective of your business you sometimes might miss the small edges that make big differences. However, you can follow a different approach.
If you have an array of processes which you can separate, analyze and then put back together, you can see some impressive outcomes.
By breaking down your processes, you can spot the minor flaws, gaps or inconsistencies standing between you and your goals. Data analytics helps you spot and then address these issues, improving the overall performance of your company.
Let’s look at one great example from McKinsey. Here, a large steel manufacturer applied different analytics methods to examine the crucial stages in their business processes. They carefully analyzed planning, forecasting, procurement and inventory management – each area in isolation and in detail – to develop small improvements that brought huge gains.
Step 4. Don’t be misled by data
Awash in a sea of data, it’s easy to make poor decisions based on bad info. But how can data actually be wrong? What we mean is misleading, inaccurate or fragmented data, and data taken out of context. Data is not a what you see is what you get proposition.
That’s why it is crucial to know how to understand and interpret the numbers in your reports, and what needs special attention in order to be sure you can trust your data. Here are some tips:
Avoid data blindness and become data smart
Data paves the way to effective decision-making process, but be aware of a trap you can fall into if you make it the only source of truth: data blindness. This is the product of being unable to see beyond the data you have at hand. Data requires context to be truly valuable and help you make decisions.
For instance, reports obtained from your analytics tools tell you that your social media campaign isn’t generating any sales. Or it could tell you that it’s not boosting conversions.
That would imply that you need to cut the campaign short and shift your resources elsewhere. Maybe the campaign can actually generate conversions when executed in the form of direct traffic.
You see the point here. The complete picture is easy to miss when blind reliance on data and analytics tools impacts your perception of real results. You narrow your perspective to short-term results without grasping the long-term outcomes.
However, you can shift your focus and look beyond data to see the wider context. According to Himanshu Sharma, the founder of Optimize Smart, this is called being data smart.
Your actions and decision-making aren’t based on just data – you treat data as a means to an end, not the only determinant.
It also means that decision-making includes:
- collective know-how of the organization and the industry it operates in
- business and marketing activities outside the digital ecosystem
- most recommended methods for data analysis, interpretation and statistics
Verify your samples
First of all, be skeptical when you get interesting statistics. Check how the data was gathered. In statistics, sampling is a means used to evaluate only a fragment of a total population.
Free Comparison of 4 Enterprise-Ready Customer Data Platforms
Get to know 25 key differences between Tealium, Ensighten, BlueVenn and Piwik PRO to find out which platform fits your business’s needs
Download FREE ComparisonTake the example of A/B testing. The purpose is not to measure conversion rates, but rather to obtain a statistically representative sample. Here’s where the trouble comes in. Sampling is very often a source of inaccurate data because samples frequently tend to be too small or unrepresentative of a population.
Be careful with unrepresentative samples and bias
In general, sampling is a tricky matter. When a sample doesn’t accurately represent the population, the result is bias. For instance, bias caused by an unrepresentative sample is called selection bias.
One of the most common sources of unrepresentative samples are surveys. A lot depends on who conducts the survey and who responds to it.
For instance, you may be dealing with so-called convenience samples. That’s the case when a pollster chooses respondents that they can conveniently reach.
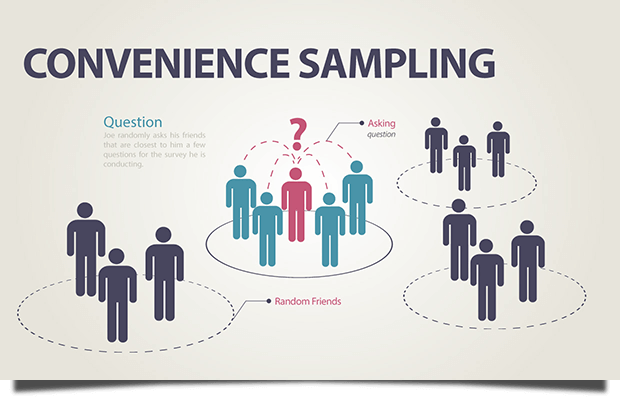
Such samples include respondents who are simply easier to select or most likely to participate, but won’t be representative of hard-to-reach people.
Ultimately, you can’t expect to have reliable survey results based on such samples because the process is flawed from the start.
Don’t be too picky
When selecting your samples, avoid being over-selective just to prove a point. It’s easy to end up with skewed results by choosing samples biased in favor of your judgment or opinions. That could be the case when you:
- poll only your best customers (more of them favor your products than those in other groups)
- examine the best-performing segments in a campaign; it’s easy to spot a winner
Proper sampling is no easy feat. You need to stay alert and review your sampling if the data seems strange. When working on your own data, don’t just pick and choose things that confirm your preconceptions.
Take storytelling with a pinch of skepticism
When conducting data analysis for decision-making you might come across the storytelling method. That’s one of the culprits of skewed results, for example in the form of the post hoc fallacy. This a logical error that happens when we know that something happened earlier, and mistakenly believe that this event was the cause of another one that happened next.
Marketing often entails this kind of storytelling, which is simply stating that certain actions bring about particular results.
But how does it affect analysis? Consider the seasonality of analytics data. If you start from zero and you’ve never done any optimization, almost any data-based decisions you make will likely lead to improvement.
Be wary when looking at data visualization
Visualizing data might be tricky and there are many traps to fall into. Even a simple change to a graph or grouping of data can lead to misrepresentation of facts. You can also manipulate data to change the conclusions people draw from it.
Moreover, data visualizations frequently requires additional descriptions because they’re only understandable for analysts. It also can generate confusion and distort perceptions of reality.
For instance, pie charts are inherently hard to read and skew proportions. Another problem you can encounter are cropped axes (broken y-axis chart), a method used to reduce how much data is visible or to emphasize certain information.
The problem with data visualizations is that they can be very subjective. You can play with them in such a way that you reveal or hide selected data just to prove your point.

Seemingly the same pie charts, but bar charts reveal the discrepancies. Source
Step 5. Focus on fixing customers’ problems rather than meeting KPIs
As we’ve already explained, if you want take advantage of your data you need look beyond numbers. This, of course, applies to dry KPIs, which are just raw numbers. Putting this approach into practice means that you put customers’ problems in the spotlight and you conduct a survey.
That’s your instrument for quickly uncovering problems that users might be encountering. Whether it’s technical problems or customer support lags, the feedback you receive helps you fix the most burning issues on the spot. You won’t be wasting time on things users don’t care about.
Systematic surveys that generate direct data from your customers should be a significant part of your strategy.
Step 6. Answer your data questions with a customer data platform
Technological advancements allow marketers to collect an abundance. However, the current structure of most marketing stacks makes data fragmented and scattered across a range of tools.
What’s more, problems like marketing automation fatigue and the rise of PQL are issues that SaaS stacks can’t resolve. The emergence of customer data platforms fits the bill perfectly.
First of all, you can seamlessly integrate a customer data platform with every SaaS product from your stack. It lets you merge and precisely analyze gathered data.
In this way you can better understand and draw out essential insights about your organization. Finally, you can act on those findings to make data-driven business decisions.
As a customer data platform unifies your data, it provides a single customer view that serves as a pillar for your marketing campaigns. But not just any data will do: you need data that helps you better understand your customers and their relationship with your brand.
You’re looking for answers to questions like:
- Is the user active?
- Has the user made a purchase already?
- What are the user’s communication preferences: email, phone, something else?
- How many tickets did the user open within a month?
- What is the user’s latest interest/intent?
- What’s the value of a particular user?
- Is this customer likely to churn?
With a CDP you can take advantage of complex marketing technology. The platform lets you gather all valuable information on your customers without concerns over data fragmentation or tactic fatigue.
The data you obtain provides a starting point for devising your strategy to create bespoke experiences for spot-on marketing campaigns.
Step 7. Make sure data works for the sake of your entire organization
First and foremost, data fuels your decision making, but you need collect it so it can serve the needs of the entire company. Your organization is like a living organism in which everything is connected to everything else, so the actions of one team impact the rest of them.
It might be challenging at first to connect all the dots, which is why you need to identify the roadblocks keeping you from finding the solution.
A problem companies often have to deal with is acting on a single isolated data set. Different departments within your organization, whether it’s finance, operations, HR, or sales, manage separate data collections. It’s vital to connect them as one set may fill the gap of another and you can find untapped value somewhere in between.
Free Comparison of 4 Enterprise-Ready Customer Data Platforms
Get to know 25 key differences between Tealium, Ensighten, BlueVenn and Piwik PRO to find out which platform fits your business’s needs
Download FREE ComparisonIn the end, when you have a strategy set in place, start small, regularly verify your actions within a set time frame, and finally measure the effect on your bottom line. If you see good results then you know you’re on the right track and you should stick to it. If not, consider some adjustments or just go for a different approach.
Final thoughts
Data is one of many tools you can use to support your strategy. You’re in charge of what stays, what goes, and how you transform information into action. Remember to question your data, and look beyond your analytics dashboards to get the bigger picture.
And with powerful technologies like analytics and CDP you’ve got plenty of possibilities to collect and analyze loads of information. However, there’s no one perfect formula for making decisions based on data.
And that’s good news, because it means that in the methodical and dry world of analytics there’s still room for flexibility, creativity, intuition and human judgment.
We hope that you’ll benefit from applying at least some of the tips we’ve presented. We realize that the complexity of a decision-making process can’t be confined to a few steps, which is why we’ve focused here on the most prominent ones. But if you want to get more information, we’re here to help you out. Just…